
Grocery Store Accounting: Practical Guide for Owners


Grocery-store net profit margins typically sit near 1% to 3% of sales, so precise inventory and expense tracking matters more than raw sales volume. A store earning $10 million in annual sales at a 1% net margin keeps about $100,000, meaning a two-percentage-point error in inventory cost or expense classification could equal roughly $200,000 and erase the reported profit.
That's the counterintuitive part of grocery store accounting. A busy store can look healthy at the register while losing money through spoilage, receiving errors, unrecorded markdowns, card fees, labor, rent, and slow-moving stock. The USDA grocery-industry benchmark helps explain why sales growth alone doesn't prove that an operation is improving.
Table of Contents
Why Grocery Store Accounting Demands Closer Control Than Most Retailers - Revenue is only the starting point - Controls that deserve a fixed schedule
Choosing the Right Inventory Valuation Method for Your Store - What changes when prices rise - A practical selection process
Tracking Inventory Shrink as a Controllable Cost Instead of a Mystery - Build the bridge from book stock to physical stock - Turn accounting into an action loop
Setting Up a Grocery-Specific Chart of Accounts and Journal Entries - Common Grocery Journal Entries
QuickBooks Online vs Xero for Grocery Bookkeeping Workflows - Where QuickBooks Online fits - Where Xero fits
Monthly Close Checklist and Key Performance Indicators for Grocers - A workable close sequence - The dashboard that explains margin movement
When Higher Inventory Turns Hide Real Operating Problems - Test turnover against availability - Gross sales can conceal channel losses
Scaling Your Grocery Bookkeeping With In-House Control or Expert Support
Why Grocery Store Accounting Demands Closer Control Than Most Retailers
A grocery owner can watch sales rise and still have less cash at month-end. The reason is simple: gross margin is not net margin. The markup on a carton of milk or a prepared meal may produce gross profit, but that profit must absorb payroll, utilities, rent, distribution, technology, credit-card fees, spoilage, shrink, and other operating costs.
Suppose the income statement shows strong revenue and a reasonable gross margin. If the bookkeeper has delayed inventory write-offs, coded freight inconsistently, or posted processor deposits without the related fees, the reported result can be materially wrong. In a business with thin profitability, the error doesn't need to be dramatic to change an operating profit into a loss.
Revenue is only the starting point
The most useful question isn't “How much did we sell?” It's “How much did we retain after the cost of the goods and the cost of operating the store?” A department can generate impressive sales while losing margin through excessive waste, promotional pricing, inaccurate counts, or purchasing at unfavorable vendor prices.
The USDA source describes actual grocery profit margins as generally clustering near 1% to 3% of sales, while a 2023 consumer survey estimated grocery-store margins at 35.2%. That gap shows why owners must distinguish the product markup customers see from the net income the business ultimately keeps.
Practical rule: Treat every month-end reconciliation as a profit-protection task, not an administrative ritual.
Controls that deserve a fixed schedule
A workable grocery close usually includes recurring bank reconciliations, merchant-settlement checks, sales-tax coding, inventory-to-general-ledger validation, and timely income statements. These controls give the owner a chance to act while the problem is still operational, such as a receiving issue or a fresh-food ordering pattern, rather than after the annual accounts are finalized.
A high-sales month may conceal declining profitability if product costs or operating expenses rise faster than revenue. The ledger needs to show that relationship clearly, by department and by channel where possible.
Choosing the Right Inventory Valuation Method for Your Store
Inventory valuation determines which purchase costs flow into cost of goods sold and which remain in ending inventory. That choice matters when vendor prices move, particularly during inflation, because FIFO, LIFO, and weighted-average cost can produce different gross profit, taxable income, and inventory balances from the same purchasing activity.
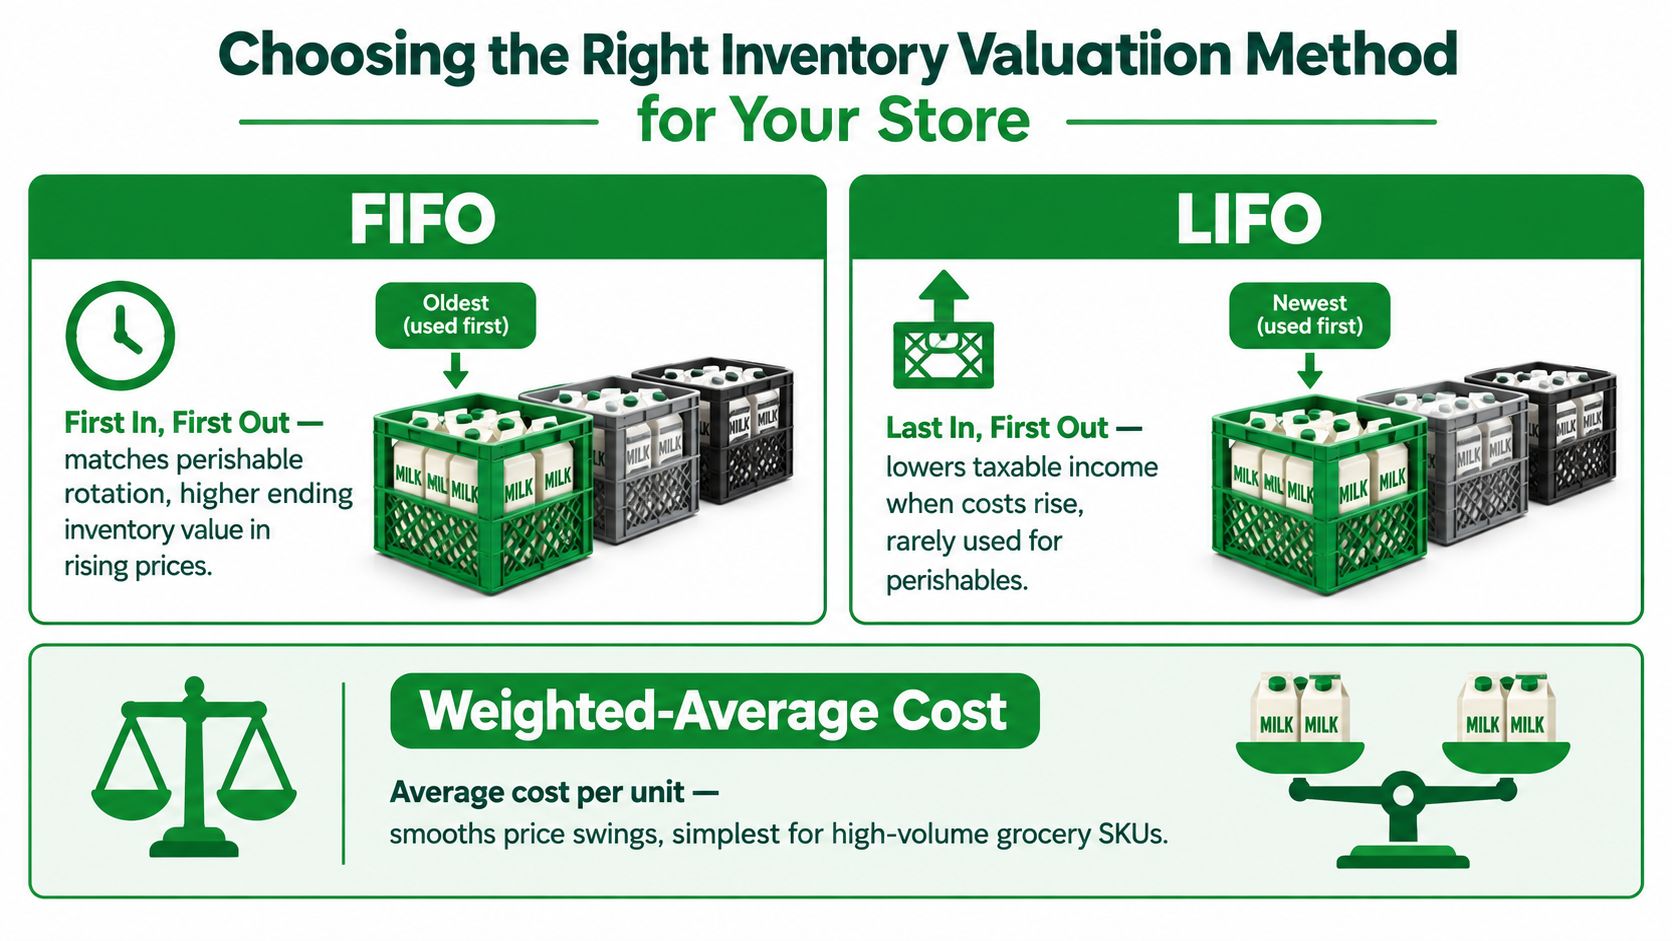
Under FIFO, the oldest costs are assigned to sales first. That approach often resembles the physical movement of grocery goods, especially where staff rotate older products forward. Under LIFO, the newest costs flow into cost of goods sold first. Weighted-average cost blends available unit costs, smoothing fluctuations across high-volume items.
What changes when prices rise
During inflation, FIFO generally reports lower current-period cost of goods sold and higher profit than LIFO. LIFO reflects newer, higher costs in earnings sooner, which generally lowers taxable income and ending-inventory values. The tax effect can be useful, but it also means financial statements may look different from a store using FIFO.
LIFO gained statutory recognition in the United States during the late 1930s. It was permitted for certain inventories under the Revenue Act of 1938, and the Revenue Act of 1939 expanded eligibility to all taxpayers. International reporting differs. IFRS prohibits LIFO and permits methods such as FIFO or weighted-average cost under IAS 2, while U.S. GAAP continues to permit LIFO subject to the U.S. conformity rule. These rules are summarized in the historical overview of supermarket inventory accounting.
A practical selection process
Choose the method with your tax adviser and financial-reporting requirements in mind, then document it in the accounting procedures. The documentation should identify the method, the inventory categories it covers, how purchase costs are assigned, and how adjustments are approved.
Match the method to the operation: FIFO may fit products that physically rotate from older stock to newer stock. Weighted-average cost may be easier for large volumes of similar shelf-stable SKUs.
Separate accounting from physical handling: A store can use FIFO accounting while operational mistakes still cause old products to expire. The valuation method doesn't replace rotation, counts, or markdown controls.
Reconcile consistently: Compare physical or cycle counts with perpetual records and investigate material differences rather than forcing the ledger to match an unexplained target.
Document changes: A method change can alter reported margins and tax results. Record the reason, approval, effective date, and financial impact.
For owners comparing spreadsheets with dedicated systems, this UK SME stock control guide offers useful context on how control methods affect inventory reliability. Keep the accounting policy aligned with the store's POS and inventory workflow, and review related principles in lower-of-cost-or-market accounting.
Tracking Inventory Shrink as a Controllable Cost Instead of a Mystery
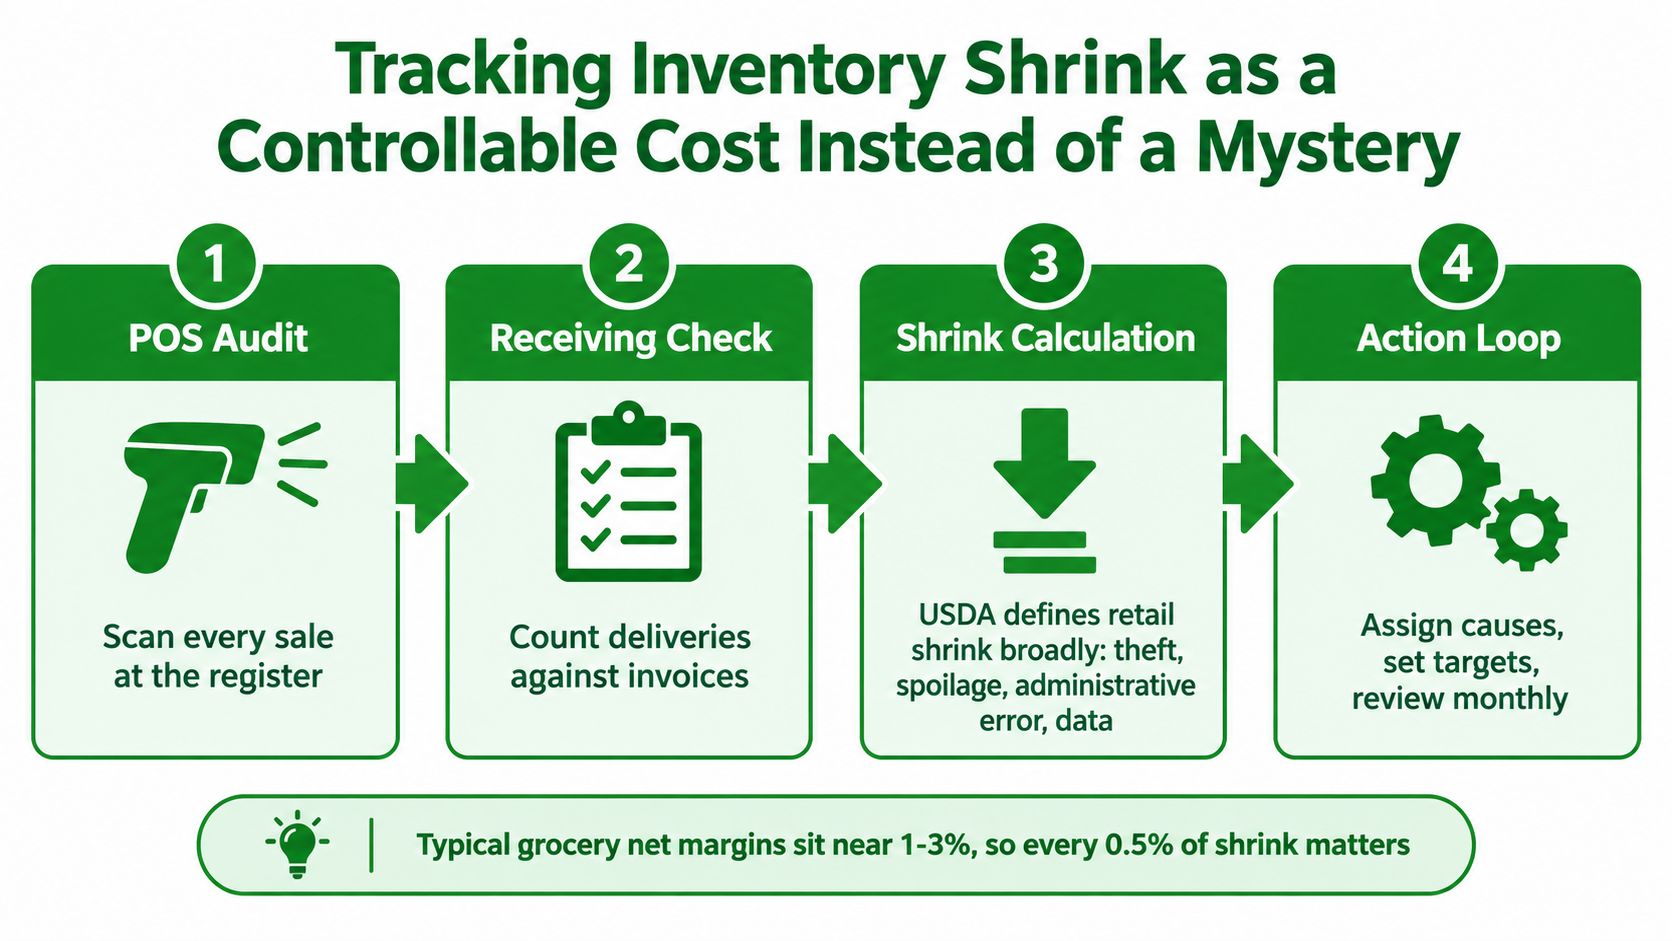
Shrink isn't one thing. The USDA defines retail shrink broadly to include food loss, theft, accounting errors, and other causes, estimating it by comparing retailer shipment data with sales data by commodity and year. A grocery bookkeeper should turn that broad category into a department-level shrink bridge that explains where expected inventory became physical inventory.
Build the bridge from book stock to physical stock
Start with the perpetual POS balance. Add verified receipts and approved adjustments, subtract recorded sales and documented returns, then compare the result with a physical count or cycle count. The difference becomes the starting point for investigation, not a plug that disappears into a generic inventory adjustment account.
Classify the variance by cause:
Spoilage: Products expired, wilted, temperature-damaged, or otherwise became unsellable.
Markdowns: The store reduced prices but failed to record the related inventory impact correctly.
Receiving errors: Quantities, prices, substitutions, or short deliveries were entered incorrectly.
Scanning errors: A sale used the wrong SKU, price, department, or unit of measure.
Theft or unexplained loss: The remaining difference requires targeted operational review.
Fresh departments deserve closer attention because their loss exposure is materially higher than that of shelf-stable goods. A single store-wide shrink percentage can hide a produce problem, a receiving problem in dairy, or a pricing issue in prepared foods.
Turn accounting into an action loop
The monthly report should show inventory shrink as a percentage of sales by department, then connect each variance to an operational response. Spoilage may call for shorter ordering cycles or earlier markdowns. Receiving differences may require invoice matching at the dock. Temperature-related loss may point to equipment or handling controls, while unexplained variance may justify targeted cycle counts.
The USDA retail shrink guidance supports treating shrink as measurable loss rather than an unexplained year-end adjustment. That distinction matters because an entry tells you what happened financially, while classification helps the manager change what happens next month.
Setting Up a Grocery-Specific Chart of Accounts and Journal Entries
A grocery chart of accounts should follow the movement of products and cash through the business. Keep sales categories separate enough to compare departments, but don't create an account for every SKU. The POS should retain item-level detail, while the general ledger should make purchasing, COGS, shrink, payroll, taxes, and channel performance visible.
A practical structure may include:
Revenue: In-store grocery, fresh departments, prepared foods, delivery, marketplace sales, gift-card redemptions, and sales returns.
Inventory and COGS: Merchandise inventory, fresh inventory, freight-in, purchase returns, markdowns, spoilage, shrink variance, and purchase-price variance.
Operating expenses: Payroll, benefits, rent, utilities, merchant fees, delivery commissions, fulfillment labor, repairs, software, and insurance.
Liabilities: Accounts payable, sales-tax payable, gift-card liability, payroll liabilities, processor clearing, and customer refunds payable.
For a deeper account-mapping framework, use this guide to set up a retail chart of accounts.
Common Grocery Journal Entries
Transaction | Debit Account | Credit Account | Purpose |
|---|---|---|---|
Supplier invoice for merchandise | Merchandise inventory | Accounts payable | Records goods received and the amount owed to the vendor. |
Freight charged on purchased goods | Merchandise inventory or freight-in | Accounts payable or cash | Captures the cost of bringing inventory into the store. |
Spoilage write-off | Spoilage expense or COGS | Merchandise inventory | Removes goods that can no longer generate revenue. |
Markdown adjustment | Markdown expense or COGS | Merchandise inventory | Records the cost impact of goods sold below the original expected price. |
Shrink variance | Shrink variance expense or COGS | Merchandise inventory | Removes the difference between book inventory and verified physical inventory. |
Sales-tax collection | Cash, processor clearing, or accounts receivable | Sales revenue and sales-tax payable | Separates revenue from tax collected for remittance. |
Processor settlement | Bank and merchant-fee expense | Processor clearing | Reconciles the net bank deposit to gross sales less fees and other adjustments. |
Don't post every bank deposit directly to sales. That shortcut hides refunds, card fees, gift-card activity, sales tax, and settlement timing. A POS summary should feed the ledger through mapped clearing accounts, with exceptions reviewed before the close is finalized.
QuickBooks Online vs Xero for Grocery Bookkeeping Workflows
QuickBooks Online and Xero can both support grocery bookkeeping, but neither platform removes the need for a reliable POS and inventory-control process. The important comparison isn't which application has the longest feature list. It's whether the system can receive clean summaries, preserve department detail, and make exceptions easy to trace.
Where QuickBooks Online fits
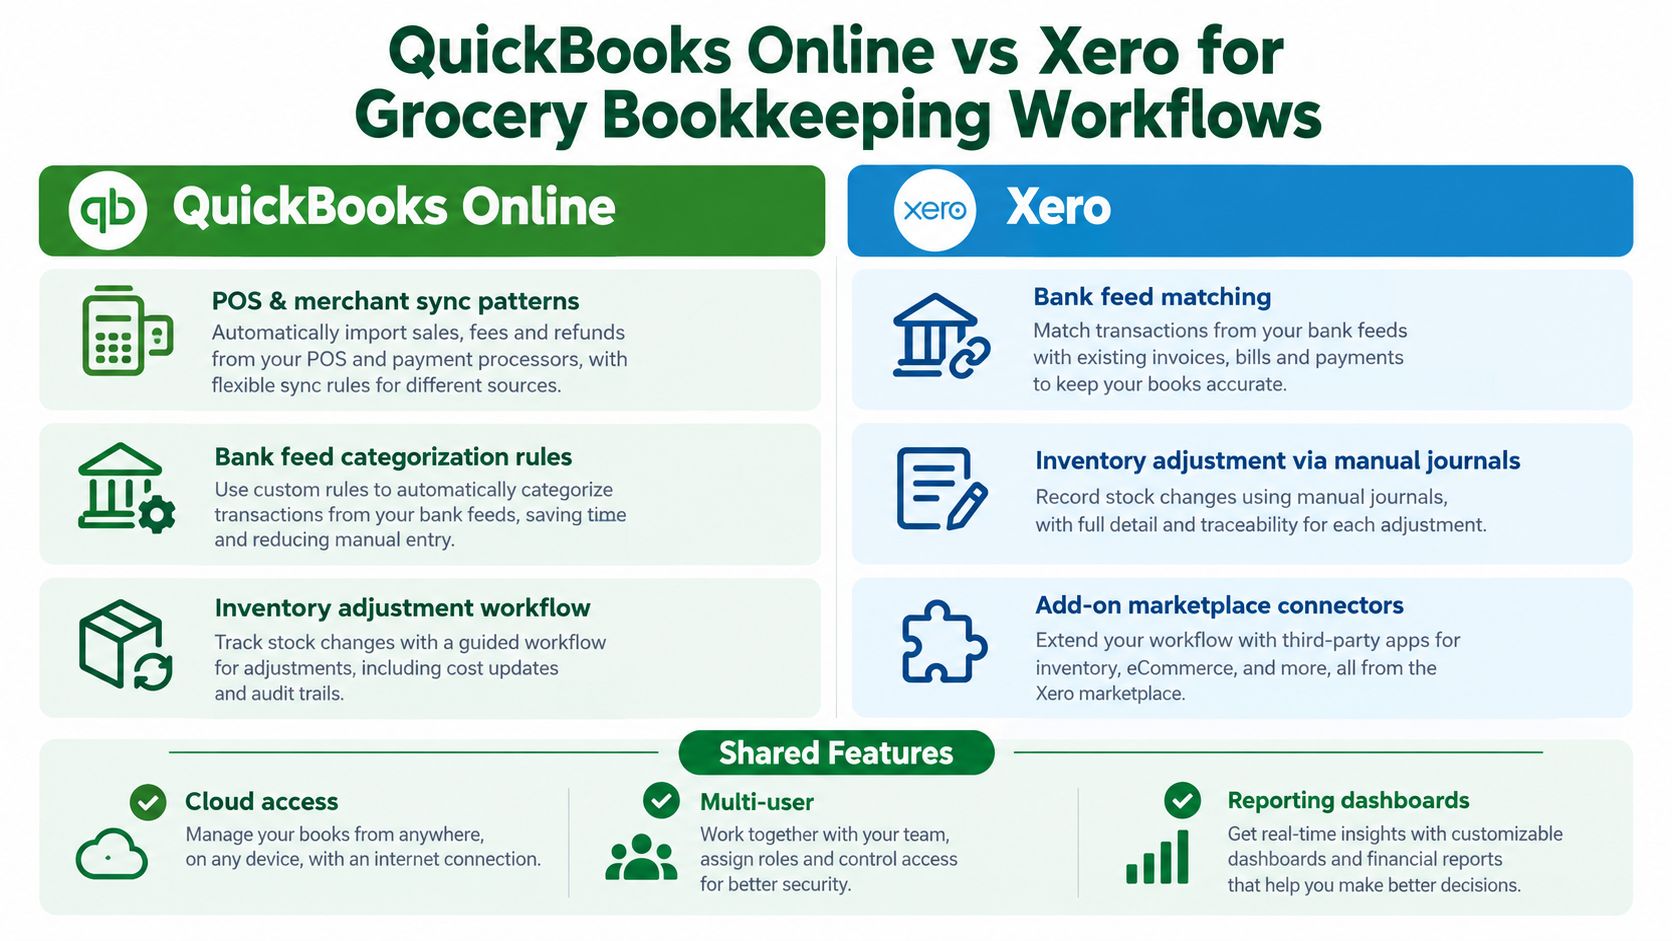
QuickBooks Online often works well when the bookkeeper needs familiar bank feeds, customizable account mapping, sales-tax tracking, and broad integration options. A grocery workflow can use a POS summary by department, post payment types to clearing accounts, and record inventory adjustments through controlled journal entries.
The weakness appears when the POS sends only a lump-sum daily total. QuickBooks Online may show a balanced entry while hiding whether the difference came from returns, gift cards, processor fees, delivery commissions, or a department-level margin problem. The integration needs clear mapping and a reconciliation owner.
Where Xero fits
Xero's bank-feed matching and add-on ecosystem can support a similar structure. It can work effectively for operators who want a clean ledger, connected payment data, and manual journals for inventory adjustments. The same limitation remains: the accounting platform won't know whether physical stock matches the POS unless someone performs the count and investigates variances.
Workflow concern | QuickBooks Online | Xero |
|---|---|---|
POS summaries | Useful with mapped sales and clearing accounts | Useful with mapped sales and clearing accounts |
Bank reconciliation | Strong fit for deposit and fee matching | Strong fit for bank-feed matching |
Inventory adjustments | Controlled journal or adjustment workflow | Manual journal and adjustment workflow |
Department reporting | Depends heavily on POS detail and account design | Depends heavily on POS detail and account design |
Multi-location needs | Requires disciplined class, location, or reporting setup | Requires disciplined tracking and reporting setup |
Operators with contractors, delivery staff, or other nonemployee labor can also consult this contractor tax software guide when assessing the broader bookkeeping stack. For the platform decision itself, compare the workflows in Xero versus QuickBooks, then test a real settlement file before committing.
Monthly Close Checklist and Key Performance Indicators for Grocers
A grocery close should produce decisions, not just a completed reconciliation. The bookkeeper needs to connect POS activity, supplier invoices, inventory counts, merchant settlements, tax liabilities, and operating expenses before the owner reviews the income statement.
A workable close sequence
Reconcile bank accounts and payment processors. Match deposits to POS settlement reports, then record card fees, refunds, chargebacks, holds, and timing differences.
Match purchasing records. Compare supplier invoices with receiving reports, purchase returns, allowances, freight-in, and accounts payable.
Validate inventory. Reconcile physical or cycle counts to perpetual POS records, and post spoilage, markdowns, damage, and shrink by department.
Review sales tax. Confirm that taxable and exempt categories are mapped correctly and that the liability account agrees with filed or pending returns.
Accrue missing costs. Record unpaid processor fees, pending refunds, delivery commissions, fulfillment labor, and other costs incurred before the statement arrives.
Review the statements. Compare current gross margin, expenses, cash, inventory, and payable balances with the operating explanation from store managers.
Use this QuickBooks Online month-end close checklist as a starting point, then add grocery-specific controls rather than relying on a generic close.
The dashboard that explains margin movement
Track gross-margin percentage, shrink percentage, inventory turns, aged or near-expiry inventory, purchase-price variance, and gross margin return on inventory investment. Review them together. A falling gross margin with rising purchase-price variance suggests a vendor or pricing issue, while stable purchase prices with increasing shrink points toward counts, receiving, waste, or theft.
Inventory turns also need context. A high ratio can reflect efficient purchasing, but it can also reflect under-ordering or incomplete loss capture. The dashboard should help the owner choose an action, not just display a favorable-looking number.
When Higher Inventory Turns Hide Real Operating Problems
Fast inventory turnover sounds positive because products leave the store quickly. It isn't automatically healthy. A store can achieve rapid turnover by carrying too little stock, creating frequent out-of-stocks, or failing to record shrink completely.
A 2025 independent-grocer study covering 93 participants and 626 stores reported inventory turns of 17.8, shrink of 3.5% of sales, and total expenses of 25.8% of sales in its benchmark data. Those figures belong in the same conversation. High movement doesn't prove that the store captured every loss or earned an adequate return after operating expenses. See the independent-grocer financial study for the published benchmark context.
Test turnover against availability
Review stockouts, substitutions, emergency purchases, near-expiry inventory, and department-level shrink alongside turns. If turnover rises while shelves are empty and lost sales increase, the buying process may be too lean. If turnover rises while shrink remains unexplained, the POS may be overstating how efficiently inventory moves.
Omnichannel sales create another distortion. A delivery order may include picking time, substitutions, refunds, commissions, card fees, and fulfillment labor that don't appear in the product gross margin. The store needs a channel-level contribution margin, not just a combined sales total.
Gross sales can conceal channel losses
Food-retail profit margins were reported at 2.1% in 2025, with about 11% of food retailers posting a loss, while payroll and benefit costs continued rising, according to industry margin reporting. These figures reinforce the need to evaluate the economics after channel-specific costs, rather than treating online revenue as automatically incremental profit.
For each channel, reconcile orders to deposits and settlements, then assign discounts, returns, commissions, fulfillment labor, and payment fees consistently. A low-basket delivery order may increase reported revenue while weakening contribution margin. The accounting system should make that visible before the owner expands the channel.
Scaling Your Grocery Bookkeeping With In-House Control or Expert Support
In-house bookkeeping can work when the owner has disciplined receiving procedures, a dependable POS, regular counts, and enough time to investigate exceptions. It becomes fragile when the same person is buying inventory, managing staff, handling vendors, and trying to close the books after the store shuts.
A sensible decision framework looks at transaction volume, number of locations, perishables exposure, sales channels, tax complexity, and owner bandwidth. Keep routine data entry close to the operation, but don't confuse proximity with control. Someone still needs to reconcile deposits, inventory, payables, tax liabilities, and financial statements independently enough to catch errors.
A bookkeeping partner should be able to work in QuickBooks Online or Xero, understand POS settlement files, document inventory adjustments, support sales-tax reporting, and produce statements on a defined close schedule. Ask how the firm handles processor clearing accounts, physical-count variances, vendor credits, gift-card liabilities, marketplace settlements, and data security before signing an engagement.
Book Tech's grocery-store bookkeeping service is one option for owners who want recurring reconciliations, inventory and POS support, sales-tax tracking, vendor payment management, and tax-ready financials handled through a virtual US-based workflow.
Book Tech LLC can help grocery operators reconcile POS sales and payment deposits, organize inventory and shrink entries, manage sales tax and vendor payables, and maintain QuickBooks Online or Xero records. Visit Book Tech LLC to discuss a grocery-specific bookkeeping workflow and request a no-pressure consultation.
